rKnowledge Exploration
rKnowledge is an attempt to unify theories, concepts and methodologies from a variety of scientific fields, including economics, geography, innovation studies, scientometrics and bibliometrics, and management and organizational sciences.
rKnowledge is an interactive platform that provides advanced Knowledge Space indicators for regional economies to inform and assist economic development practitioners and science, technology & innovation policymakers.
Unifying theories, concepts and methodologies from a variety of scientific fields, the platform is a gateway to novel and advanced research highlights and empirical evidence in the realm of knowledge production, recombination, and diffusion processes, and the socio-spatial dynamics thereof.
The principles of (r)ecombinant Knowledge production, and tracing its evolution in space provides ample insights into current opportunities to pursue a bottom-up approach to regional economic development, and as such aims to contribute to the establishment of more effective and productive science, technology & innovation policies capable to address contemporary grand challenges and ultimately resulting in societal gain and prosperity.
The following is a short introductory video highlights the interactive dashboard, and in particular the advanced knowledge space indicators that are featured there that aim to enable users to explore specific regional knowledge spaces in detail.
Smart Specialisation Strategy (S3)
rKnowledge directly links to regional Smart Specialisation Strategies (S3) policy making.
In an attempt to unleash the innovative potential of regional economies, S3 are currently implemented across most European regions. However, investigations on whether S3 initiatives adequately match local knowledge capabilities are very scarce. The following recent publication, along with the accompanying further documentation concerning each regions’ S3 and its embeddedness in the local knowledge space, offers advanced opportunities for policy evaluation and to develop progressive place-based policy actions.
In the Research section we provide further information of how rKnowledge theory and methods are applied to advanced investigations of technological change and innovation in the context of regional and national economies, as well as firms and specific technology sectors.
The following publications outline how the principles of (r)ecombinant Knowledge production processes are utilized to generate regional knowledge spaces, as well as a number of highly relevant recent studies that apply this advanced approach.
- The “original” attempt to construct regional knowledge spaces
- The “real” potential in regional knowledge spaces
- Technological diversification and its impact on productivity
- Knowledge recombination on production efficiency
- Technology network structure in conjunction with economic resilience
- Knowledge spillovers and scientific and technical knowledge production in AI
How to use the rKnowledge Dasboard?
1
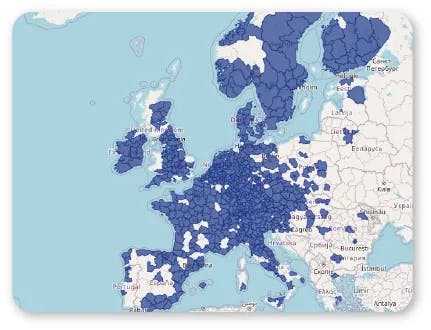
Select your region of interest in the interactive map at the top
You can zoom in-and out and drag the embedded map. Selection of the target region can be done by clicking on the map or choosing with the Region.
2
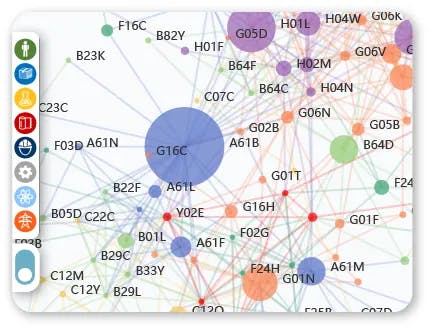
Knowledge space
The knowledge space is based on a co-occurrence matrix determined by the recombination of technology classes in patented inventions. Thus, the relative proximity between nodes indicates how frequently two knowledge domains are listed together on individual patent documents. The size of the nodes shows how frequently a knowledge domain serves for the development of inventions in general. There are 650 possible technology classes and they are grouped into 8 overarching technology sectors as highlighted to the left. It is possible to switch on and off sectors, and to zoom in and out as well as drag the space across. Further, the interface allows to switch between the full regional knowledge space (default) to one that only displays specialised knowledge domain in the region as outlined in the description of knowledge space indicators below. In this regard, clicking on a specific note will deliver all indicators in the two graphs displayed to the right of the space.
3
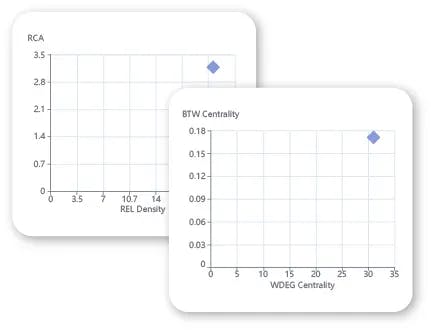
The four main indicators
Revealed Comparative Advantage (RCA) together with Relatedness Density indicates the level of specialisation and how connected a specific knowledge domain is to other specialised technology classes in the region. Betweenness and Weighted Degree Centrality measures specify if a particular domain is very central in the space, i.e., well connected to others, and if it acts as a broker between different clusters of knowledge domains in the regional knowledge space. For further information, please see the next section that provides an overview of the 4 main indicators, as well as the following publication.
4
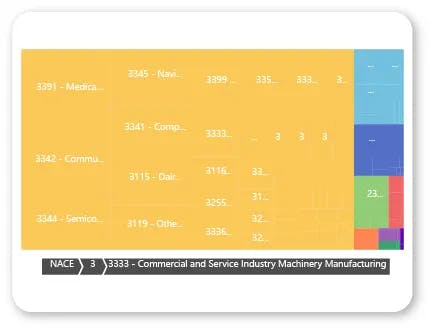
Knowledge translated into industry sectors
At the bottom of the page, you have the option to also display the regional knowledge space in terms of relevant industry sectors in the form of a treemap.
How to interpret the 4 knowledge space indicators
Relatedness Density and RCA
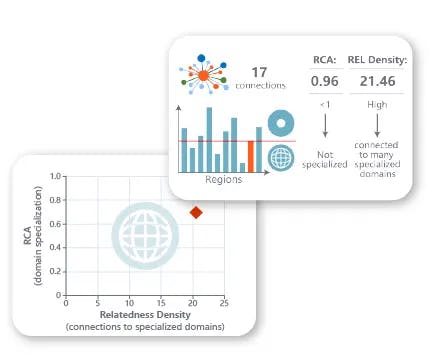
Revealed Comparative Advantage (RCA) indicates how “specialised” a knowledge domain is in the regional knowledge space. An RCA=1 indicates that the regional share of a technology class is equal to the share of that particular class in the entire pan-European space. Thus, an RCA=2 implies that the share of said class in the regional knowledge space is double of that what is observed in the portfolio of the entire EU knowledge space. Similar, an RCA ≤1 signals that a technology class is less prominent in the region than it is in the overall EU portfolio. Knowledge domains that are close to an RCA=1, and that are well embedded in the regional knowledge space provide ample opportunities for future regional specialisation.
Relatedness Density indicates how embedded a particular class is via connections to other already specialised (RCA > 1) knowledge domains in the regional space. The notion is that a class that is not specialized yet (RCA ≤1), but is connected to already present specialisations, is more likely to transition to a regional specialised knowledge domain in the future. Investments into classes that are less frequently combined with other classes, especially non specialised classes, are more likely to fail than investing into nearly specialised and well-connected classes.
Betweenness and Weighted Degree Centrality
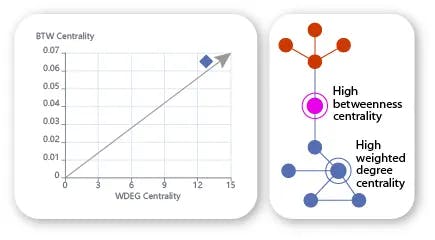
Building on established network analysis methods, these two measures indicate the level of embeddedness of a specific knowledge domain in the regional knowledge space, but also if a domain serves as a broker between various clusters of classes in the space. Specifically, a high value on the Weighted Degree Centrality measure indicates that a knowledge domain is frequently recombined on a single invention with a diverse set of other classes and as such is a frequent ingredient in the knowledge production process. A high Betweenness Centrality measure indicates that a particular knowledge domain connects different clusters of classes and thus serves as a broker in the local knowledge space.